

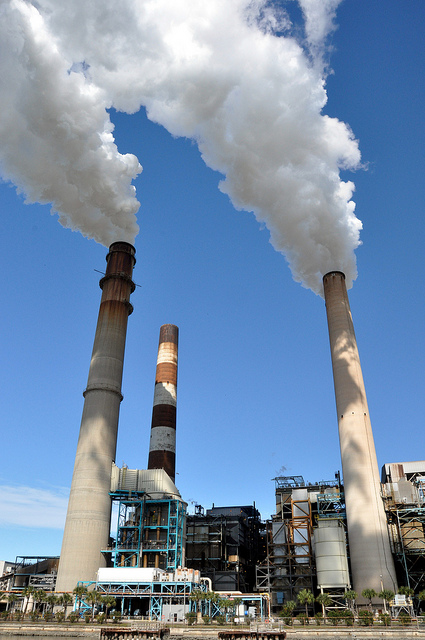
Image Credit: Image #1: Walter / Flickr.com
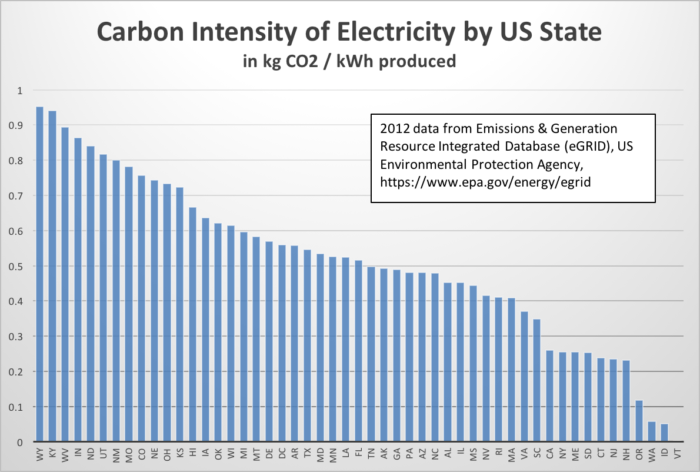
Image Credit: Image #1: Walter / Flickr.com State-by-state carbon intensity. The high-intensity states burn a lot of coal.
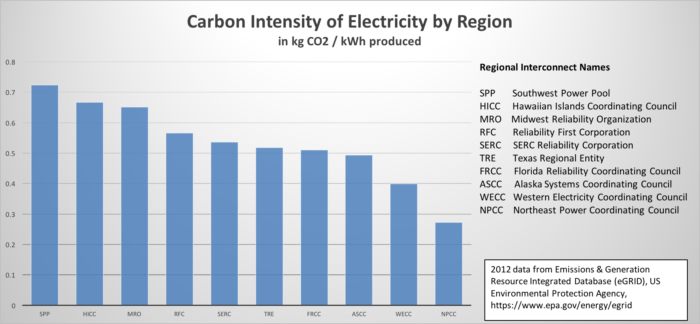
Image Credit: Images #2 and #3: Energy Vanguard, using eGRID data Carbon intensity of each regional interconnect group of the grid.
More Building Science


Lately I’ve been working on my presentation for the 10th anniversary of the North American Passive House Conference. It’s on the global warming impact of insulation, a followup to my latest article about Alex Wilson’s work on that subject.
One of the things I wanted to do was to see what difference it made when a home used “dirty electricity,” with a high carbon intensity, versus a home using “clean electricity.” The Emissions & Generation Resource Integrated Database (eGRID) from the US Environmental Protection Agency has data that’s close to what I was looking for. Let’s take a look.
State-by-state carbon intensity
When you scroll to the bottom of the eGRID page, you’ll see a link for eGRID2012 Data File (XLS). That gets you their full data set. It includes data for more things than I was looking for: It’s got SOx and NOx and mercury and all kinds of good data, split up various ways.
What I wanted was carbon intensity of electricity in the 50 states of the U.S. and different regions, and that was in there. They gave it in units of pounds per megawatt-hour and I wanted kilograms per kilowatt-hour, but that was an easy calculation.
Once I had kilograms of CO2 emissions per kWh of electricity produced in a single column, I could see which states were best and which were worst. The first chart (see Image #2, below) shows those data so you can see easily where your state fits in.
Here in Georgia, I’m in the middle of the pack at about 0.5 kg/kWh. The worst states are Wyoming, Kentucky, and West Virginia. Know what they have in common? The best is Vermont, which is so low you can’t even see the column on this chart. Their number is 0.002 kg/kWh.
Problems with the state data
One important fact to note about this chart is that the numbers here are for electricity generated in each state, not the electricity used. To get closer to the latter number, you’d need to include the losses due to transmission and distribution, which aren’t included in the eGRID data. There’s not much in the way of carbon emissions related to the transmission and distribution losses, so the kg CO2 number doesn’t change. But the number of kilowatt-hours decreases, and that has an important effect on all those numbers in the chart. They all get bigger.
The second factor that affects your number is the import and export of electricity among states. My friend Skylar Swinford in Idaho puts it this way:
“I often hear people in Washington and Idaho brag that we have such clean electricity. First I want to say that the social, cultural and ecological impacts/costs of hydroelectricity should not be glossed over. Second, any kWh of hydro wasted by an Idaho or Washington end user will result in that kWh not being exported to another state that then must burn fossil fuels to offset it. We don’t operate on an island, so energy consumption in one state directly impacts the energy mix in all the states located in each interconnect.”
So, the state-by-state chart of carbon intensity gives you a glimpse into the carbon story, but it’s a bit misleading. A better number to use would be the carbon intensity for the regional interconnect that you live in. The second chart (see Image #3, below) shows the eGRID data for the regional interconnects. Unfortunately, they don’t include Canada, so the numbers for the regions that trade with Canada aren’t an accurate representation of carbon intensity.
As you can tell, finding the right data to use for carbon emissions related to the generation of electricity is a bit tricky. If you have other sources of data that show the full picture, please let me know.
Allison Bailes of Decatur, Georgia, is a speaker, writer, building science consultant, and the author of the Energy Vanguard Blog. Check out his in-depth course, Mastering Building Science at Heatspring Learning Institute, and follow him on Twitter at @EnergyVanguard.
Weekly Newsletter
Get building science and energy efficiency advice, plus special offers, in your inbox.


9 Comments
But that is Y2012 data! Let's get real!
Since 2012 the wind power alone has taken a huge chunk out of the carbon footprint of states from Texas & Oklahoma to Iowa and North Dakota, and the displacement of coal fired generation has made a large difference in many US states.
The Clean Power Plan (CPP) also uses the same 2012 data as a baseline, but also projects Y2020 emissons under business as usual, as well as 2020 & beyond projections up to 2030. The installation of renewables have exceeded DOE projections (by a lot!), and many states are already below the Y2020 projections. Using the CPP's Y2020 BAU projections would be the HIGHEST carbon numbers PassiveHouse should be using.
https://www.epa.gov/cleanpowerplantoolbox/clean-power-plan-state-specific-fact-sheets
https://www3.epa.gov/airquality/cpptoolbox/georgia.pdf
And even that is an exaggeration. The CPP is barely a stripe on the floor, and whether or not the D.C. District court blesses it after hearings later this month, most states will be under those numbers base on the economics of steeply cheaper renewables.
In last March's blog on the carbon footprint of mini-splits I used the CPP projections for the crude estimate:
https://www.greenbuildingadvisor.com/blogs/dept/guest-blogs/carbon-footprint-minisplits
We need more than Skylar Swinford's say so to support the thesis that excess hydro capacity would end up being exported to where it would offset fossil burner power. Most of the time excess hydro is merely curtailed. While I'm comfortable with the notion that even legacy hydro has an ongoing environmental footprint and should not be wasted, the thesis that efficiency in WA/OR/ID will in fact result in higher exports offsetting fossil burning needs to be supported by data, and show the math. The notion that PassiveHouse is lower impact than Net Zero Energy in that region would also have to be supported by the math. (I'm personally skeptical, on that front, to say the least.)
Skylar, I just had my mental
Skylar, I just had my mental alarm bells set off by your trying to connect the year 2000 brownouts in California with the subject at hand. One can find bad data and then quote it for any subject under the sun. The thesis in the Hamilton and Taylor article is literally worthless. I personally remember the summer that those power outages occurred. Everyone of them, if memory serves, were brought about by electricity plants going down for "maintenance" during the peak air conditioning times. This outright physical manipulation of the plants is so well known that that it beggars belief that it would be brought up here. I'm trying to be polite even though it may not seem so.
Missing The Point, No Crisis Should Go Wasted
Eric,
I don't disagree with you, but I think you missed the point of why I included the article which is that that electrons flow from the PNW to California. Enron was a fraud. Enron (and their affiliates) indeed fabricated a "fake" energy crisis in 2000-2001 that led to brownouts and blackouts, but their fake crisis was partly made possible by other factors including drought in the PNW. Even without Enron, the drought in the PNW and several other factors were creating problems for California. Clearly Enron did not waste the crisis and actively fueled it to defraud consumers for billions.
You don't have to take my word for it and I encourage you to skim through the FERCs official report, The Western Energy Crisis, the Enron Bankruptcy, and FERC’s Response, which includes a chronology of events that led to the energy crisis in California. Below is from the second paragraph of the report:
"A number of factors contributed to the Western Energy Crisis of 2000 and 2001. These included: a low rate of generation having been built in California in the preceding years making California dependent on imports of electricity; northwestern drought conditions resulting in lower than expected water runoff for hydropower generation; a rupture and subsequent capacity constraints on a major pipeline supplier of natural gas to California markets (California was heavily dependent on gas-fired generation due to state air standards); strong economic growth and thus increased electricity demand throughout the west; and unusually high temperatures coupled with an increase in unplanned plant outages of older plants that were being run to meet increased demand in California. Further, transmission line constraints within California, both for imports and exports of electricity, exacerbated an already marginal situation during this time period. Finally, some energy companies attempted to manipulate wholesale electric and gas markets."
https://www.ferc.gov/industries/electric/indus-act/wec/chron/chronology.pdf
Back to the original point. If the act of linking drought to the California energy crisis led to you being unconvinced that the PNW exports surplus hydroelectricity, perhaps hearing directly from the California Energy Commission that their state imports hydroelectricity from the PNW will help you come around.
From the CEC, California’s Drought: Impact on Hydroelectricity:
"Depending on the available water supply, California’s electric IOUs and POUs will continue to use stored water to produce electricity during hot summer days, and will continue to import hydroelectricity from the Pacific Northwest and Hoover Dam in the Southwest."
http://www.energy.ca.gov/commission/fact_sheets/documents/Californias_Drought_Impact_on_Hydroelectricity_FS.pdf
Hydroelectric Power in California:
"The state also imports approximately 4 percent of its hydro-generated electricity from the Pacific Northwest."
http://www.energy.ca.gov/hydroelectric/
Also more from the EIA below.
A quarter of California's electricity comes from outside the state:
"While the map shows annual data, some of the flows in the West are seasonal. For instance, the hydroelectric capacity in the Pacific Northwest generates large amounts of electricity (and therefore large transfers to other regions). River flows and hydroelectric generation are typically highest in spring and early summer. The chart shows increased flows out of the Northwest in May, June, and July of 2010. This coincides with increased receipts of power in California as the low-cost hydroelectric power displaces electricity generated from more expensive generators. Some of the displaced generators are located in the Southwest as the outflow of power from this region drops during these months. At other times of the year, power from the generators in the Southwest flowing out of the region increases to offset the diminished flows coming from the Northwest."
http://www.eia.gov/todayinenergy/detail.cfm?id=4370
The Columbia River Basin provides more than 40% of total U.S. hydroelectric generation:
"A significant amount of hydroelectric power generated in the Northwest is consumed by California customers. In the late 1960s, BPA constructed two 500-kilovolt transmission lines capable of carrying power from the Pacific Northwest to the Los Angeles area. The Pacific Northwest-Southwest intertie was completed in 1971, giving Los Angeles consumers access to hydroelectric power originating from the Pacific Northwest."
http://www.eia.gov/todayinenergy/detail.cfm?id=16891#
Electricity flows south
Dana,
Your post suggests that the PNW (Pacific Northwest) states do not export hydroelectricity to other states and most of the time simply “curtail” generation when output exceeds in-state demand. I’d love to read more about why and when this happens. That statement seems to go against the whole point of an interconnected grid as well as the information presented in the articles below. Honestly I haven’t ready many posts from you over the years that I disagree with so I’m ready and willing to accept I’m on the wrong side of history on this one.
I wish I had access to up-to-date and comprehensive data on electricity exports and imports between states. Please point me in the right direction if you know the best place to look. I’m certainly not an expert on the electrical grid and while my quote in the article is indeed my opinion it was simply an early morning iMessage exchange with Allison. Luckily he left out the litany of emojis.
Send me some good info and I’m happy to publicly update my opinion (not that anyone cares).
This article from the EIA (link below), illustrates that electricity tends to flow south from the Northwest region: “…excess, low-cost power—primarily from hydroelectric generators in the Pacific Northwest, Manitoba, and Quebec—supplied higher-cost markets to the south.”
http://www.eia.gov/todayinenergy/detail.cfm?id=4270
As it’s name suggests the Western Interconnect is indeed very interconnected. Does EVERY kWh saved in ID, WA, OR directly offset a dirtier kWh that would have been produced elsewhere in the Western Interconnect? This I do not know. What I do know is that Idaho does not generate enough electricity to satisfy its own demand and the state must rely on neighboring states to import their fossil fuel generated electricity.
Even if Idaho is not exporting any hydroelectricity, the state’s highly “renewable” electricity generation mix still does not match its consumption mix.
By some estimates almost half of the electricity consumed in Idaho comes from coal power from other states:
http://boisestatepublicradio.org/post/report-ranks-idaho-1-green-energy-coal-imports-show-different-picture#stream/0
http://snakeriveralliance.org/wp-content/uploads/2012/08/Kicking-Idahos-Coal-Habit_Aug-22-2012.pdf
Similar story in Oregon:
“But there’s a big difference between renewable energy production in Oregon and consumption…According to Ken Dragoon, senior resource analyst with the Northwest Power and Conservation Council, 30 to 40 percent of that wind energy goes to California to meet renewable energy mandates down there. Meanwhile, nearly 40 percent of Oregon’s electricity consumption comes from coal-fired power plants – many of which are in Wyoming and Montana. About 15 percent of the state’s power comes from natural gas. With all the hydropower and renewable energy development in Oregon, Shimshak said, “it’s probably a surprise to most people that more than 45 percent of our electricity comes from fossil fuels.””
http://www.opb.org/news/blog/ecotrope/why-oregon-imports-power-from-fossil-fuels-and-exports-renewable-energy/
See Net Interchange by Balancing Authority Area from the 2016 State of the Interconnection:
“Net Interchange Regional variation in seasonal demand and an abundance of generation capacity in the Pacific Northwest and Southwest, combined with high demand in California, cause electricity to flow in a “doughnut” pattern. In 2014, California imported 75,400 GWh, more than a quarter of its internal demand for the year. This was nearly evenly split between imports from the Northwest and the Southwest.”
https://www.wecc.biz/Reliability/2016%20SOTI%20Final.pdf
You might be interested in checking out more about the Pacific Northwest/Pacific Southwest Intertie which is, “is the high-voltage electron highway of transmission lines that allows the Columbia River to flow to California in the form of electricity.”
https://www.nwcouncil.org/history/Intertie
“To alleviate some of the havoc created by a lack of electrical energy as well as to benefit the power users economically, a plan to interconnect the Pacific Northwest and the Pacific Southwest was developed beginning in 1949. The interconnection of these two regions would alleviate an existing seasonal excess capacity of energy by transferring energy between the two areas. When use of power increased in the summer in the Southwest because of increased air conditioning to deal with the heat, the surplus energy available in the Northwest could be transferred south to meet the higher demand. The reverse could be implemented in the winter months when power use increased in the Northwest due to heating needs and decreased in the Southwest.”
http://www.usbr.gov/history/ProjectHistories/PACIFIC%20NORTHWEST-PACIFIC%20SOUTHWEST%20INTERTIE%20MASTER%20ZLA%20HC%20FC%20BC%20IC%20SC%207.2010.pdf
The paper, Brownouts in California Brown Fields, describes how power exchanges between California and the PNW help both regions match demand and supply and how drought in the west and deregulation combined to contribute to the California Power crisis of 2000 (EDIT: Eric states the obvious in his comment below that Enron intentionally and illegaly poured fuel on this crisis and fleeced ratepayers for billions) :
http://ageconsearch.umn.edu/bitstream/131931/2/Hamilton%26Taylor.pdf
These articles seem to suggest that there is indeed a fairly free flow of electricity between the states in the Western Interconnect. It is likely that much of this is changing fast as our electricity grid rapidly evolves and I’d love to learn more if you send the articles this way.
Skylar,
I have a problem
Skylar,
I have a problem with your argumentative style. Again, if you were interested less in creating your own narrative then you either wouldn't have used the 2000 meltdown in California as an argument, or you would have used the entire picture surrounding it. It's kind of like recounting the history of WWII in Japan and then failing to mention that the first atomic bombs was dropped there on people.
Also FERC was famously intransigent with regard to the whole situation that was going on at the time. Under George W Bush he nominated several members to FERC that were very friendly to the Texas oil industry. Bush and Cheney simply didn't want to hear that their friends were criminals. Glancing at the FERC report it is obvious to me that it is a self serving report to diminish the effect of their political affiliation through the White House of their blind spot in regard to Enron.
It would be nice if you could offer some references and quotes from people who didn't already have an agenda.
Electricity markets are complex to be sure.
Electricity markets are complex, but the regulations are state-local. Yes, the net power flows are from the PNW to the southwest, but the mere existences of excess low carb capacity in WA/ID from conservation doesn't automatically result in that power being exported and purchased in AZ or CA.
Contracted-for wind power from PNW wind farms to CA utilities to meet their renewables targets are part of the southward flow, but it is are at pricing typically higher than the average wholesale price of power in CA or PNW and also higher than the average wholesale prices in AZ. Only during peak load events when the pricing is favorable and adequate transmission capacity is available does excess capacity in the PNW get purchased in those remote markets. But it still doesn't happen unless the importing utilities or system operators are willing to pay for it.
During the ongoing drought more power had been exported to the SW, but the amount of power import to the SW doesn't increase with freed-up capacity in the PNW. If the hydro plants were being operated at full nameplate capacity during periods of import to the SW that might happen, but under typical conditions that doesn't really happen. The power needs of the SW don't rise and fall with the ability of the PNW to deliver more power, and the price of imported power comes with a transmission tariff cost added. The capacity of the transmission grid has it's limits, and puts an upper bound on instantaneous flows well below output capacity of the BPA. Even if it were available, and priced to move, it can't without more transmission capacity.
Further the California Independent System Operator ( CAISO ) does not have direct dispatch control over PNW power sources the way they do with local power sources. CAISO is very interested in expanding the western markets into an integrated regional power market to make rapid changes in import (and potentially higher net import) possible, but to date that is still in the blue-sky trial balloon stage:
http://www.utilitydive.com/news/taming-the-wild-west-caiso-begins-study-of-a-full-regional-electricity-mar/414213/
Their interest is primarily from a grid-balancing point of view, for better grid stability as intermittent renewables expand with the potential for large amounts of mid-day excess. Some of that grid balancing power could be delivered by PNW hydro, and some of the bulk power could too, but again, this is future tense "maybe, some day", and not engraved in stone, still under study. An integrated western market is also a way to dump a mid-day glut of CA PV, with more favorable economics than more grid storage. Well within the lifecycle of a house or rooftop PV system, the western regional generation sources and operating modes will have morphed to something very different from what it is today. With a fully open and integrated western market southwestern PV would likely be shipped to remote markets mid-day to remote loads whenever the transmission tariffs were lower than local storage costs, and PNW hydro would be shipped on a similar basis. That isn't the way it happens today.
Storage costs are also coming down, and grid scale battery can be designed, delivered and integrated an order of magnitude faster than a gas-fired peaker can, and the operating costs are lower. The Aliso Canyon storage leak that put southern California peaking plants back on their heels prompted RFPs over the summer for more rapid deployment of battery to deal with the substation grid conjestion problems that idled peakers would create during peak periods. Southern California Edison has signed up for a 20Mwh pack (with 80MW peak power) to deal with it, and according to their vendor (Tesla) it will be installed and running before the end of this year:
https://www.tesla.com/blog/addressing-peak-energy-demand-tesla-powerpack
Just try to get an 80mW peaker conceived of bid, and built in anything like that time frame, or even 10x that amount of time!
Both California and Oregon have storage mandates, and that is going to dramatically change how much peak power is imported by 2020, and how much natural gas is wasted in spinning reserves regionally, whether or not the western regional power markets become more integrated.
So, when looking at PassiveHouse vs. Net Zero Energy with PV on the roof, it's still not at all clear that PassiveHouse is going to be the lowest-carbon choice. In the nearer term rooftop PV is going to be delivering a large fraction of it's output during heavy air conditioning load hours, offsetting fossil fired peaking power when the wind & hydro assets can't carry the load. As more PV gets built, idling those fossil fire assets during the daylight hour that characteristic will be less valuable than it is today, but by the time that happens it's likely that slow-ramping generators such as thermal coal will have long since been idled along with fossil fired peakers as better demand response and storage (on both sides of the ratepayers meter) get built, even if only CA & OR are building storage (how likely is that?)
This is all moving very fast, but direction is clear, and the rate of implementation regularly beats even the well-informed prognosticators' expectations. Fully a third of the utility scale PV plants being built in 2016 will be outside of state Renewables Portfolio Standards, based on the raw economics alone, even cutting into coal fired generators' capacity factors. The price of solar (both utility and residential scale) continues to fall faster than the rate at which federal subsidies in the US are scheduled to scale back. Utility scale solar (unsubsidised) will be the absolute lowest lifecycle new generator power source by 2020 (I used to think it was going to be after 2025), and it already is in places like Texas. The ERCOT grid operator in Texas is now anticipating that nearly all coal fired capacity on their grid will be replaced by utility scale solar in that state by 2030, and at a net savings to ratepayers:
http://www.greentechmedia.com/articles/read/solar-will-replace-nearly-all-retiring-coal-in-texas
Similarly, the remaining nuclear capacity in California will be replaced by solar, demand-response, and efficiency by 2025, also at a net savings to ratepayers, per Pacific Gas & Electric, the owner/operator of Diablo Canyon:
http://www.latimes.com/business/la-fi-nuclear-power-pacific-gas-20160811-snap-story.html
That proposal has had some pushback from other stakeholders urging the CPUC to deny it, but most analyst believe that they won't win. It'll be a done deal by the end of this calendar year.
It's as clear as mud what the comparative lifecycle carbon is of PassiveHouse vs. Net Zero would be in Idaho will be, but it seems very unlikely to favor PassiveHouse, given just how fast the grid is changing.
Even if the DC Disrict Court puts the kabosh on the CPP, it isn't going to change too much to the rate of change in the western grid. (It would change how quickly West Virginia and Kentucky decarbonize though.)
Oregon's zero-coal power by 2035 legislation passed earlier this year is just the frosting on the cake, but will move the ball faster than the CPP.
California's Senate Bill 1383 just signed into law is going to have a much larger impact than the OR legislation, and will accelerate the rate of change for the western regional grid, no matter what happens in the other states.
Wyoming wind power is deemed likely to render Wyoming coal power uneconomic before 2030 on sheer economics alone (with or without a production tax credit)- the state legislature there is scrambling trying to figure out how to tax it, in advance of pending massive build-out. The squabbling over tax issues has stalled the onset of construction in recent weeks, but there is no question that it will start soon, and will build very rapidly. The available resource there is huge, and WY will be a net exporter of primarily power within a decade. If some of the proposed transmission lines get built to have more export capacity into the western grid, the economically viable wind capacity will completely dwarf local needs *(which is why the state wants a piece of the action.) The 2030 CPP target for WY, will be exceeded, and with good margin.
Eric,
My goal wasn't to be
Eric,
My goal wasn't to be argumentative. I apologize for coming off that way. Are the EIA and CEC not worthwhile organizations to pull information from regarding the flow of energy from the PNW to the South? I'm sorry that the Cali article has proven so problematic to the discussion, but it isn't the only information source provided.
Dana, thanks for your follow-up comment. I knew I could count on you to follow-up with some great resources. I will happily dig in and take a look at everything you provided. I would be very surprised if I didn't find myself agreeing with you on most, if not all your points as I usually do.
Have a great weekend.
Skylar, not a problem
That period in California is a hot button subject for me. It sounds like you just walked into it innocently. My reaction comes from the fact that at the time it was occurring there was a lot of blaming the victim going around. It was only later that the whole story came out. There is still lots of stuff on the internet that predates the final judgement of history of that episode. It sounds like you innocently quoted some of that stuff.
And back atcha, Skylar!
We probably both already understood that Y2012 data is already woefully out of date for Allison's or PassiveHouse carbon accounting analysis, eh? The changes between now and 2020 are going to be even bigger than between 2012 and now.
And over the lifecyle of a house it comes down to Niels Bohr's
"Prediction is very difficult, especially if it's about the future."
I'm cautiously optimistic now that the lifecycle cost of renewables is at parity to or cheaper than any new fossil burning power plant. It'll definitely happen, probably sooner than most of us think. Lazard's most recent comparative levelized cost analysis from last fall gives some confidence:
https://www.lazard.com/media/2390/lazards-levelized-cost-of-energy-analysis-90.pdf
The question isn't if, but how fast it will all roll out. EIA is the last resource to turn to for projections on the growth of renewables, consistently under-estimating market growth & penetration by decades, and over-projecting costs several fold even in fairly short term predictions. They're pretty good at document the past though, but it seems to arrive after it's relevance has diminished. Working on emissions data from 2012 isn't exactly ancient history in 2016, but it's definitely history. Grid emissions have already changed substantially in the intervening four years, which is why for now I prefer to use EPA's projections, however imperfect.
In the past few weeks a grid scale solar project in Abu Dhabi had multiple bidders in the $25/Mwh range (2.5 cents per kwh). You can't come close to even fueling a nuke for that. They have the advantage of low financing and low labor costs, but pre-subsidy pricing in the US is well under 5 cents now, and falling year on year. This party is just getting started!
http://rameznaam.com/2016/09/21/new-record-low-solar-price-in-abu-dhabi-costs-plunging-faster-than-expected/
Log in or create an account to post a comment.
Sign up Log in